Table of Contents >> Show >> Hide
- Why Capture Serial Data in the Browser?
- Meet the Web Serial API
- Building a Simple Browser Serial Plotter
- Choosing the Right Chart Library for Serial Data
- Performance Tips and Common Pitfalls
- Real-World Uses: From Hackaday to Your Bench
- Hands-On Experiences and Practical Lessons
- Wrapping Up: The Browser as Your Serial Sidekick
If you’ve ever stared at a wall of numbers streaming out of a serial terminal and thought,
“There has to be a better way,” you’re in the right place. Modern browsers can talk directly
to serial devices, and with a bit of JavaScript you can turn that firehose of data into
smooth, real-time plots without installing desktop apps or juggling CSV files.
Inspired by the Hackaday feature on a “web serial plotter” that turns your browser into a
mini oscilloscope for sensor data, this guide walks through how to capture and plot serial
data in the browser using the Web Serial API and JavaScript charting libraries.
We’ll cover what the Web Serial API is, how to connect to microcontrollers and other
devices, which chart libraries work best for live data, and practical tips to keep your
plots responsive and stable.
Why Capture Serial Data in the Browser?
Historically, plotting serial data meant using desktop tools: a vendor IDE, a Python
script with matplotlib, or a dedicated logger. That workflow works, but it’s clunky:
copy from a terminal, paste into a spreadsheet, realize you forgot timestamps, repeat.
With browser-based plotting, you bypass all that.
Key advantages of browser-based serial plotting
-
Zero install for end users: As long as they have a compatible browser
(Chrome, Edge, or other Chromium-based browsers that support the Web Serial API),
they can just open a URL and click “Connect.” -
Cross-platform by default: The same page runs on Windows, macOS,
Linux, and even Chromebooks, which is why the Arduino team highlights this approach
for classroom environments. -
Easy sharing and collaboration: Want a teammate to see your live
sensor data? Share the web app link instead of walking them through driver installs
or serial terminal configs. -
Modern visualization tools: You can plug into powerful JavaScript
charting libraries like Chart.js, Plotly, or more specialized real-time engines such
as SciChart, LightningChart, or uPlot for high-frequency streams. -
Extensible UI around your data: Add sliders for scaling, dropdowns
for ports and baud rates, or buttons that send commands back to the device. You’re
not limited to a fixed tool.
In short, the browser becomes your serial dashboard: capture, control, and chart,
all in one place.
Meet the Web Serial API
The secret sauce behind browser-based serial plotting is the
Web Serial API. It’s a set of browser interfaces that lets JavaScript
discover serial ports, request permission to use them, then read and write bytes to
attached devices such as microcontrollers, USB-to-serial adapters, and Bluetooth
devices that expose a virtual COM port.
Security and permissions
Browser vendors are understandably cautious about letting websites poke at hardware.
To use the Web Serial API:
- The page must be served over HTTPS (or be running on
localhost). -
The user must explicitly pick a device from a browser prompt triggered by
navigator.serial.requestPort(). -
Permissions are scoped to the origin, so another site can’t silently reuse your
granted access.
This model aligns with other “powerful” APIs such as WebUSB and WebBluetooth:
powerful capabilities, but only after the user opts in.
Basic flow: from port selection to bytes on screen
At a high level, a browser-based serial plotter follows this sequence:
- The user clicks a “Connect” button in the UI.
-
JavaScript calls
navigator.serial.requestPort(), which opens a
browser dialog listing available ports. -
Once the user selects a device, you call
port.open()with the desired
baud rate and other serial settings. -
You grab a
ReadableStreamDefaultReaderfrom
port.readable.getReader()and start reading chunks of bytes. -
You parse those bytes (for example, newline-separated CSV values) and push them
into a chart as new data points.
MDN’s Web Serial and SerialPort documentation provide detailed examples of
this flow, showing how to handle streams, errors, and disconnect events in modern
browsers.
Building a Simple Browser Serial Plotter
Let’s imagine a common scenario: you have an Arduino-compatible board streaming
temperature readings over serial, and you want a live chart in your browser. You don’t
need a sprawling framework; a basic HTML page with some JavaScript and a chart library
is enough.
1. Prepare your device
On the microcontroller side, you typically:
- Initialize the serial interface, e.g.,
Serial.begin(115200). - Read sensor values at a fixed interval (for example, once every 100 ms).
-
Print data in a simple, machine-friendly format. A common choice is a line of
comma-separated values, like:
millis,temperatureC,humidity.
The Hackaday-featured “web serial plotter” by Atomic14 uses a similar pattern:
microcontroller code emits regular samples, while the browser parses each line and plots
it in near real time.
2. Minimal HTML structure
In your HTML file’s <body>, you might include:
- A “Connect” button.
- A badge or label showing connection status and baud rate.
- A
<canvas>or<div>element for the chart. - Optional controls for pausing, clearing, or exporting data.
This keeps the UI friendly enough for non-technical users while still exposing
engineer-friendly knobs. If you’re building a teaching tool, you can add a simple
panel that echoes the raw serial lines for debugging.
3. Connecting with the Web Serial API
The JavaScript glue has three jobs: request a port, read data, and push those readings
into your chart. Chrome’s developer documentation walks through setting up
navigator.serial, handling readable streams, and decoding text
from byte arrays using TextDecoderStream.
The nice part: once you’ve written a small “serial-to-lines” abstraction, you can reuse
it across projects. Whether your device streams temperature, light, current, or
accelerometer data, the browser logic barely changes.
4. Feeding data into a chart library
For real-time plots, you want a charting library that:
- Can efficiently update as new points arrive.
- Supports time-series or x–y plotting.
- Looks reasonable without days of customization.
According to recent roundups of JavaScript chart libraries, Chart.js, D3.js, ECharts,
ApexCharts, and Plotly.js are among the most common choices for general dashboards.
For serial data that updates many times per second, you may want a performance-focused
engine like SciChart JS, LightningChart JS, or uPlot, which are specifically tuned for
streaming and large time-series datasets. They use Canvas or WebGL under the hood to
render thousands to millions of points while keeping the frame rate smooth.
The high-level pattern is always the same:
- Initialize a chart with one or more data series.
- As each new sample arrives from the serial stream, append it to the series.
- Drop older samples when you exceed a “window” size (e.g., last 1,000 points).
- Trigger a chart update, ideally throttled to avoid repainting too often.
Choosing the Right Chart Library for Serial Data
There is no single “best” library, only better fits for your constraints. Here’s a
quick comparison through the lens of serial data plotting:
Chart.js and ApexCharts: quick wins
Tutorial sites often recommend Chart.js or ApexCharts for dashboards because they offer
a friendly API, sensible defaults, and work well with React, Vue, or Angular.
For moderate update rates (a few samples per second), they’re more than enough. If
your serial stream is a slow temperature sensor or a once-per-second status message,
these libraries will feel effortless.
Plotly.js and Highcharts: feature-rich plots
Plotly.js and Highcharts bring a ton of features: advanced axes, annotations, and
interactive tools like zoom, pan, and hover tooltips.
They shine when you want to publish charts for stakeholders who like to explore and
drill down into data. For serial projects, a live chart with built-in export and zoom
can make demos very polished with minimal extra code.
SciChart, LightningChart, and uPlot: for “too much data”
When your serial stream is fastthink signal processing, vibration analysis, or
high-rate IMU datageneric libraries can start to lag. Performance-focused engines step
in here:
-
SciChart JS emphasizes real-time dashboards with WebAssembly
acceleration and millions of points at 60 fps. -
LightningChart JS is routinely cited in developer discussions as one
of the fastest chart libraries for huge, streaming datasets. -
uPlot is a tiny, canvas-based chart library designed for fast,
memory-efficient time series.
For a Hackaday-style “oscilloscope in your browser,” these are the kinds of tools that
keep the UX snappy even when data comes in at microcontroller-clock speeds.
Performance Tips and Common Pitfalls
Serial plotting is easy to prototype and weirdly easy to overload. Here are practical
guardrails so your browser doesn’t sound like your laptop’s fans are attempting
liftoff.
Tip 1: Throttle UI updates
Even if your serial port pushes 1,000 samples per second, your eyes don’t need 1,000
chart refreshes per second. A common pattern is:
- Buffer incoming samples.
- Update the chart at a fixed interval (e.g., 10–30 times per second).
- Use
requestAnimationFrame()or a fixedsetIntervalto
schedule redraws.
This keeps rendering manageable while still looking fluid.
Tip 2: Use a sliding window
Storing every sample forever is a recipe for sluggish charts. For most real-time tasks,
you care about the recent history. Keep a rolling window (for example, the last 10
seconds or last 2,000 points), and drop older data as new samples arrive. Many chart
libraries provide APIs to remove points from the beginning of a series.
Tip 3: Prefer simple text or lightweight binary formats
Fancy protocols are unnecessary for demos. A simple line-based CSV or space-separated
format is easy to parse in JavaScript:
timestamp,valueax,ay,azvoltage,current,power
When you really need bandwidth, you can move to binary encodings but still decode in
the browser using typed arrays.
Tip 4: Handle disconnects gracefully
Serial cables get bumped, USB hubs get moody, and devices reset. The Serial API offers
events for connect and disconnect, plus error handling on streams.
A polished plotter detects these conditions, updates the UI, and lets the user reconnect
without reloading the page.
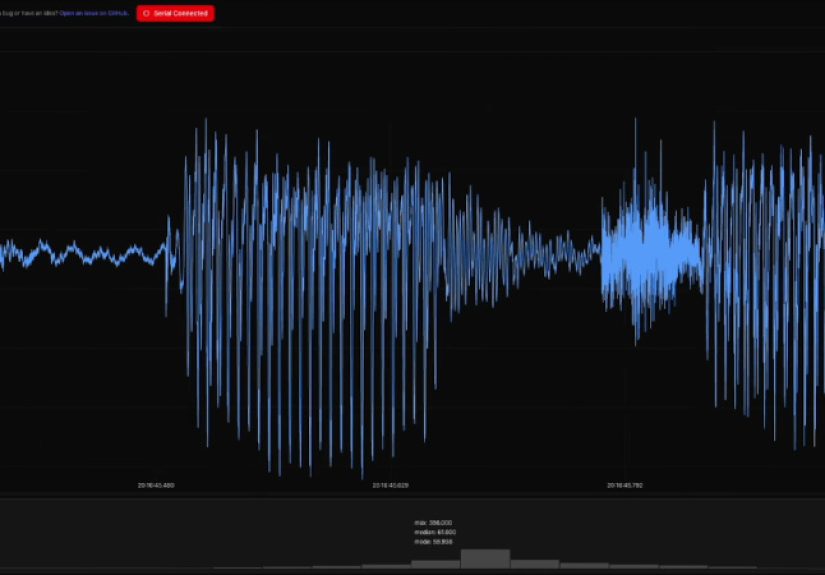
Real-World Uses: From Hackaday to Your Bench
The Hackaday-featured web serial plotter is a perfect example of how Web Serial turns
the browser into a hardware hacker’s Swiss Army knife. Instead of compiling a desktop
tool for every platform, the author ships a URL; the device speaks serial, and the page
handles plotting.
Similar techniques show up in:
-
Arduino camera demos, where camera frames are streamed as bytes over
serial and reconstructed into images in the browser. -
Chrome capability samples and codelabs that let micro:bit boards or
Arduinos send data directly to web pages for learning projects. -
Educational labs on Chromebooks, where students run browser-based
IDEs and serial monitors instead of installing desktop software.
Once you internalize the patternserial device speaks, browser listens, chart library
drawsyou can apply it to almost any bench setup: power supply logs, environmental
sensors, motor controllers, even retro hardware that only knows how to talk over an old
serial protocol.
Hands-On Experiences and Practical Lessons
On paper, “capture and plot serial data in the browser” sounds like a neat trick. In
practice, it can seriously change how you work with hardware. Here are some
experience-based insights that show up once you move beyond the first blinking line
graph.
Seeing behavior you’d never spot in a terminal
Streams of numbers are like subtitles with no movie. The moment you plot them, subtle
patterns leap out. A slowly drifting sensor that looks “fine” in a serial console
suddenly reveals a 24-hour temperature cycle when graphed. A motor driver that “randomly”
trips a fault shows a clear correlation between spikes in current and a loose belt.
A browser plotter encourages quick experiments: tweak a PID gain in firmware, reflash,
and visually check whether oscillations shrink. The latency between idea and visual
feedback is tiny, so you iterate more and guess less.
Making hardware approachable for non-embedded teammates
Many projects blend hardware and software teams. The firmware engineer might be very
comfortable tailing a serial log, but the data scientist or product manager probably
isn’t. A browser-based UI with “Connect” and “Start Plotting” buttons turns your
prototype into something others can explore without learning a terminal or a specific
IDE.
In internal tools, teams often layer features on top: toggles for different channels,
range selectors, and one-click exports that hand CSV files directly to analytics
workflows. Because it’s just HTML and JavaScript, you can iterate on the interface
quickly and respond to what people actually want to see.
Teaching and workshops: fewer installs, more learning
If you’ve ever run a workshop with 20 laptops and 20 different OS variations, you know
that half the time can disappear into driver issues and path problems. Using Web
Serial-based plotters sidesteps a lot of that. Students open a link, click to grant
port access, and start experimenting with sensor graphs, PWM duty cycles, or serial
protocols.
This is one reason browser-based tooling has become popular in the Arduino and
micro:bit communities. Participants spend more time reasoning about signals and less
time fighting with toolchains.
Choosing how “serious” your plotter needs to be
Another practical lesson: you don’t have to start with a maximalist dashboard. For some
projects, a single scrolling line graph and a label is perfect. For otherssay, a
long-running test rig that monitors dozens of channelsyou might need more formal
charting, snapshot exports, or synchronized axes.
Engineers working with complex data often discover that as they add more features,
their needs start to resemble mainstream analytics dashboards. That’s where more
powerful charting libraries, or even BI-oriented tools like Highcharts paired with a
backend, begin to make sense. The crucial insight is that you can grow from a simple
page into a sophisticated tool without abandoning the Web Serial foundation.
Thinking about reliability and safety
While browser plotting is convenient, it’s not always the right choice for critical
logging. If you’re running overnight tests or safety-critical experiments, you’ll
likely pair a browser plotter with a more robust logging path (for example, writing to
an SD card on the device or having a separate process store data on disk).
In everyday debugging, though, the convenience wins. You can spin up a quick viewer,
plug in a dev board, and get live insight into what your firmware is doingno heavy
tooling required. That’s the spirit captured in the Hackaday article: turning the browser
into a lightweight serial oscilloscope you can adapt to whatever you’re hacking on.
Wrapping Up: The Browser as Your Serial Sidekick
Capturing and plotting serial data in the browser is more than a clever demo. The Web
Serial API bridges the gap between your microcontroller and your web stack, while
modern charting libraries turn raw numbers into clear, interactive visuals. You get a
workflow that is quick to deploy, easy to share, and flexible enough to support
everything from classroom labs to serious engineering dashboards.
Whether you mirror the Hackaday-style web serial plotter or roll your own variant, the
recipe stays the same: simple serial output on the device, a browser page that reads
and parses the stream, and a chart library tuned to your performance needs. Once you’ve
built it once, you’ll find excuses to reuse it on every project that talks over serial.